Apartment wiring devices · Practical guides
A reviewable Excel quantity schedule: identifiers, coordinates and status columns
A quantity schedule should let another person reproduce its totals. Record each counted device and its location in a separate row so reviewers can check the evidence and update quantities when drawings change.
Two sheets: ‘Quantities’ and ‘Evidence’
Download the electrical takeoff Excel example
This file contains example records for only the seven items marked on the published plan. It does not represent a complete drawing quantity or completed review results.
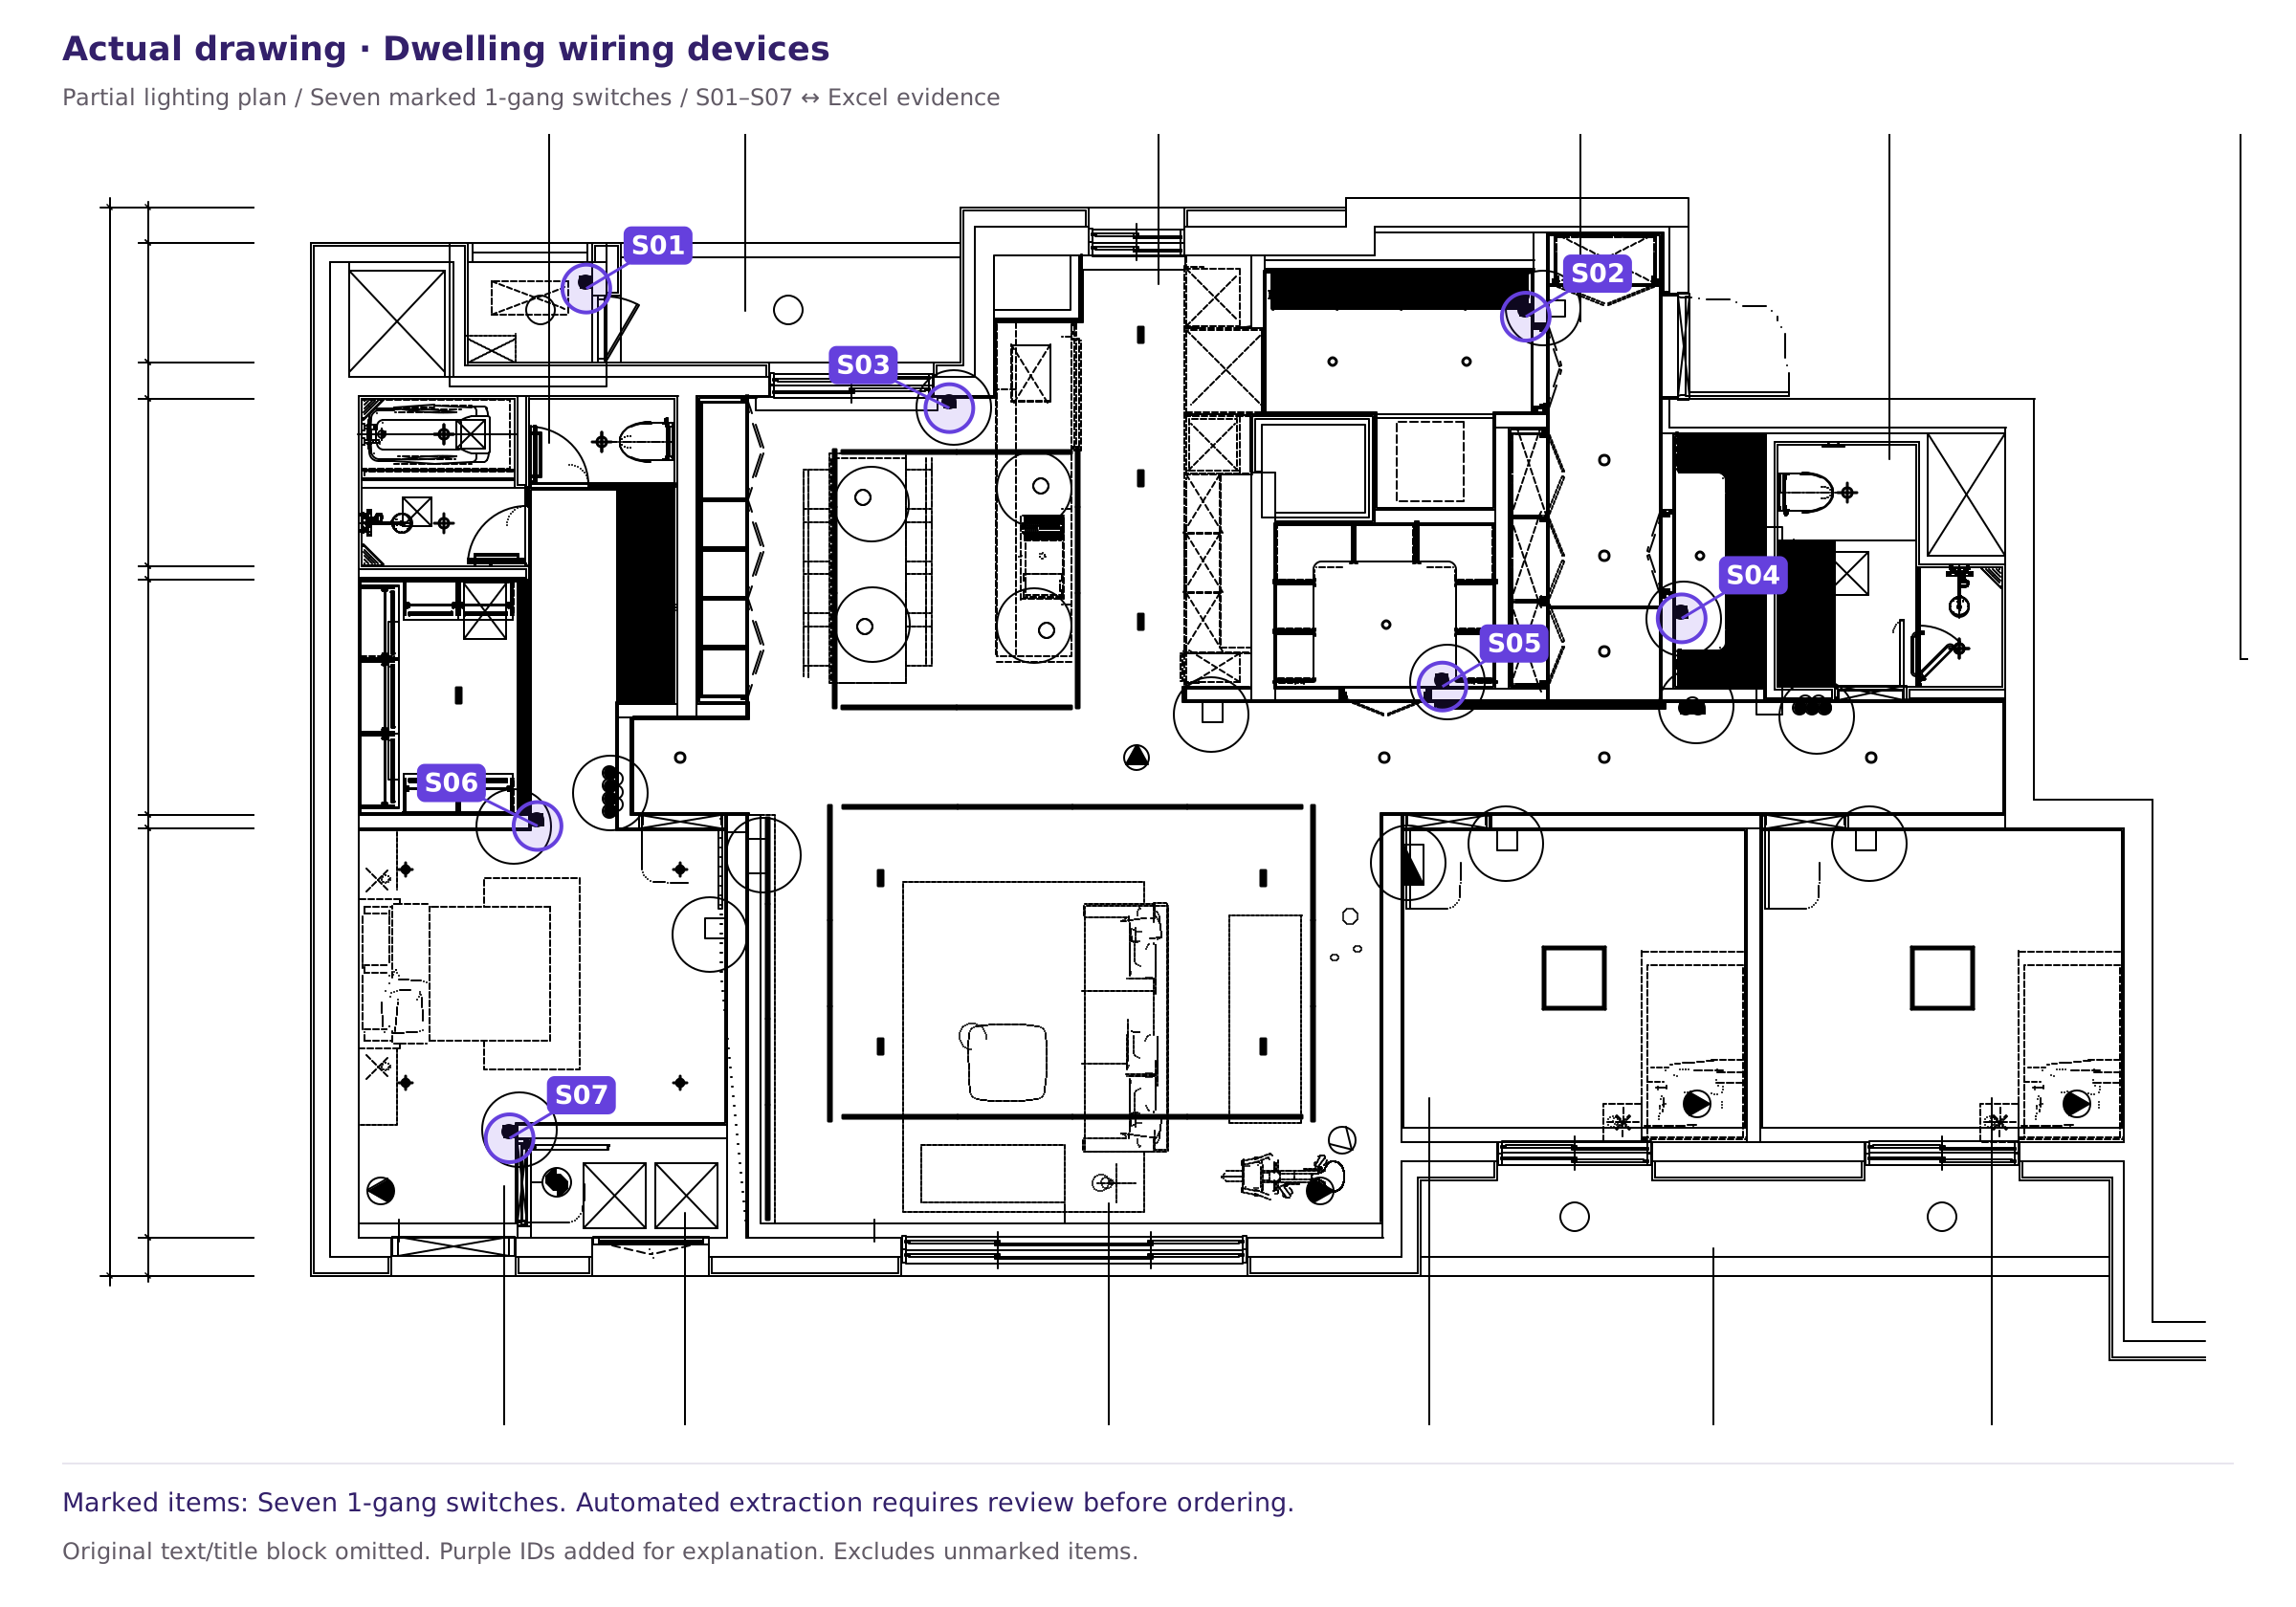
| ID | Item | Quantity | Relative X | Relative Y | Review status |
|---|---|---|---|---|---|
| S01 | 1-gang switch | 1 | 5628.66 | 11883.223 | Auto-extracted · Review required |
| S02 | 1-gang switch | 1 | 15448.987 | 11589.484 | Auto-extracted · Review required |
| S03 | 1-gang switch | 1 | 9423.625 | 10633.5 | Auto-extracted · Review required |
| S04 | 1-gang switch | 1 | 17078.234 | 8435.825 | Auto-extracted · Review required |
| S05 | 1-gang switch | 1 | 14576.949 | 7722.609 | Auto-extracted · Review required |
| S06 | 1-gang switch | 1 | 5118.75 | 6264.812 | Auto-extracted · Review required |
| S07 | 1-gang switch | 1 | 4826.984 | 3000.204 | Auto-extracted · Review required |
The formula in cell C6 of the ‘Quantities’ sheet is SUMIFS('Evidence'!$C$6:$C$12,'Evidence'!$B$6:$B$12,A6). It sums quantities in rows with the same item name, giving 7 in this example. The formula does not filter by review status.
The Evidence sheet contains one device per row. The Quantities sheet groups that evidence by item, specification and unit to calculate totals. Generate the schedule with a pivot table or SUMIFS rather than typing totals by hand, so totals update when the evidence changes.
Voltix’s Published Excel example uses the same two-sheet structure. Follow the comparison process using seven 1-gang switches, S01–S07, on an actual dwelling-unit plan.
Columns in the Evidence sheet
| Column | Details | Purpose |
|---|---|---|
| Identifier | Unique number for each device, such as S01, C14 | Link drawing labels to schedule rows |
| Drawing/sheet | Filename, sheet number and revision | Drawing version used for the count |
| Zone | Building, floor, dwelling unit, room name | Check scope and calculate building totals |
| Item/specification/unit | Item as defined by the legend | Schedule row criteria |
| X and Y coordinates | Coordinates relative to a reference point | Duplicate checking and location tracing |
| Quantity | Usually 1 | Recalculate totals |
| Status | Confirmed / Review required / Duplicate excluded / Deleted (revision) | Review status |
| Remarks | Reason for decision and query reference | Keeps decisions traceable |
Coordinates need only be relative values that let you find the device again, rather than construction coordinates. This example uses the bottom-left corner of the published area as its reference point.
Include a Status column
The statuses ‘Confirmed / Review required / Duplicate excluded / Deleted (revision)’ below are recommended for a working template. All seven rows in the current downloadable example are ‘Auto-extracted · Review required’. Do not interpret the total of 7 as a confirmed quantity. To calculate confirmed quantities, complete the review, record statuses, and use SUMIFS with an added status criterion or a pivot-table status filter.
Status is the most frequently used review column. Include only confirmed devices in the confirmed total. Show ‘Review required’ as a separate subtotal, and exclude ‘Duplicate excluded’ and ‘Deleted (revision)’ from totals while retaining their rows. The schedule can then display two figures side by side, such as ‘Confirmed 7 / Review required 1’, letting the reviewer focus on the rows requiring review.
Build the quantity summary from the evidence
- Convert the Evidence data range to an Excel table (Ctrl+T).
- In the pivot table, place item, specification and unit in Rows; sum of quantity in Values; and status in Filters.
- Filter for ‘Confirmed’ to calculate confirmed totals. Show a separate total for ‘Review required’.
- For building totals, add a zone/type column to the evidence and apply the dwelling count in the quantity summary.
Do not edit summary totals by hand. Correct the relevant Evidence row and refresh the pivot table.
Sources and scope
This article provides general guidance on reviewing apartment wiring-device quantities. For project decisions, the relevant drawing legend, revision information, specifications and contract scope take precedence. See our Editorial review and correction policy.
Technical references:Scope and limitations of the published drawing and Excel examples · Report an error or ask about supported scope